1,Market Dynamics
2,Monthly Macroeconomic Indicators
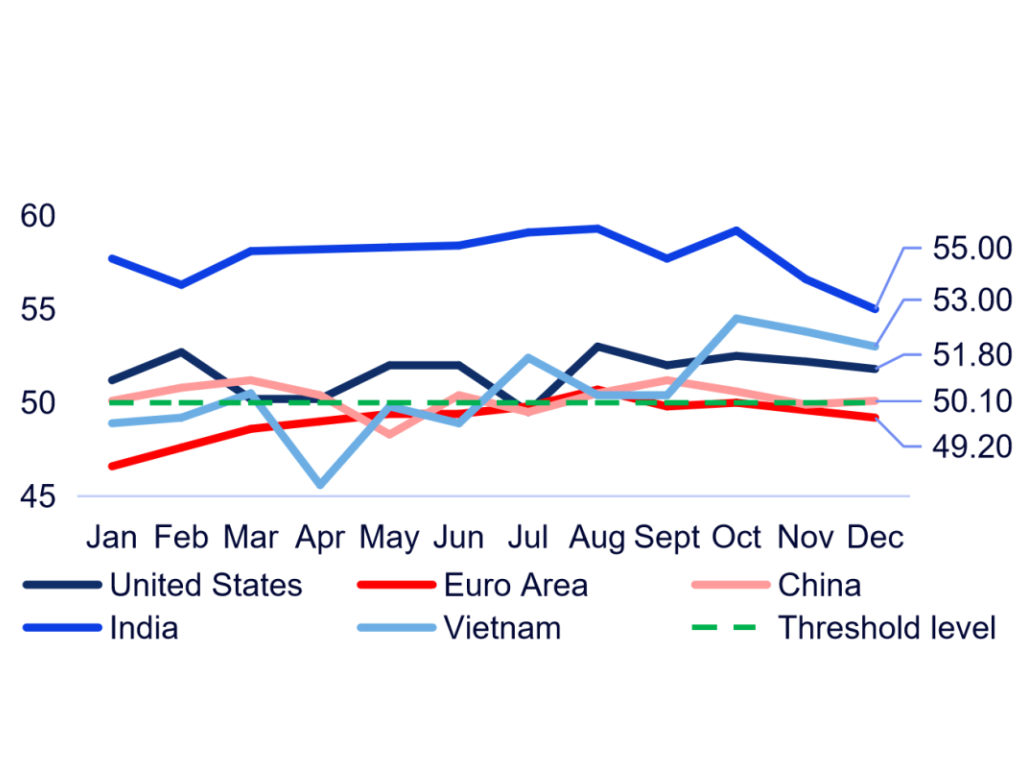
Manufacturing Purchasing Managers’ Index (PMI)*
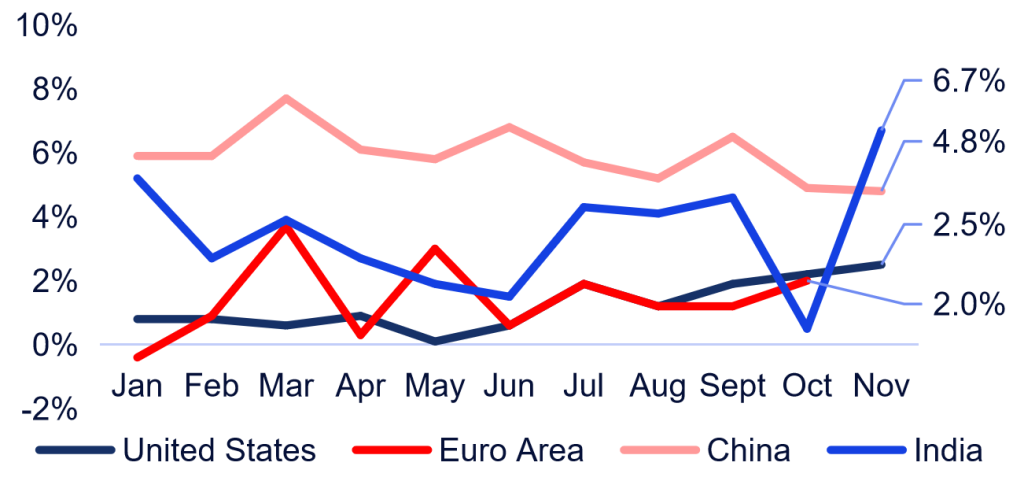
Annual Growth Rate of Industrial Production (%)
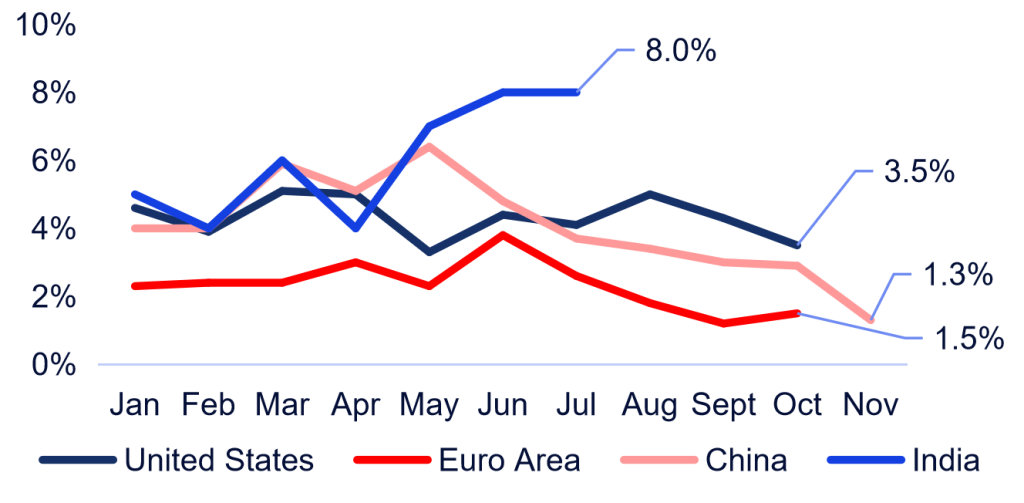
Annual Growth Rate of Retail Sales (%)
Monthly Exports (USD Billion)
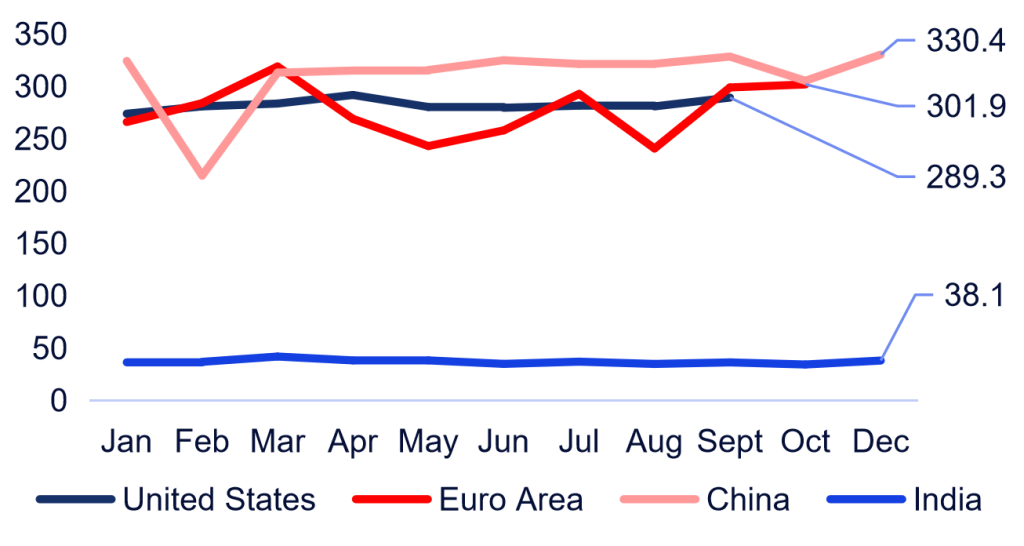
Source: Trading Economics
Note: If data for certain months is unavailable, it indicates that the figures have not yet been disclosed. *A PMI above 50 indicates economic expansion.
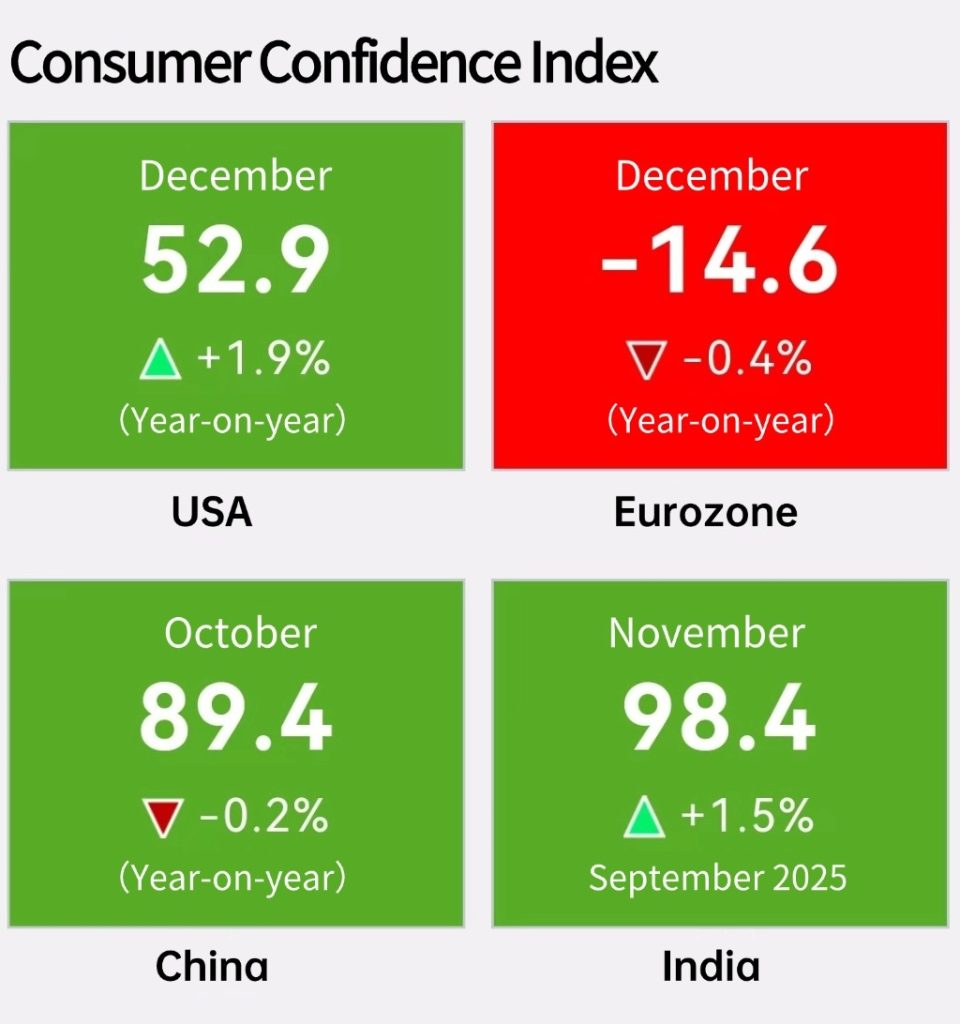
3,Consumer Confidence Index
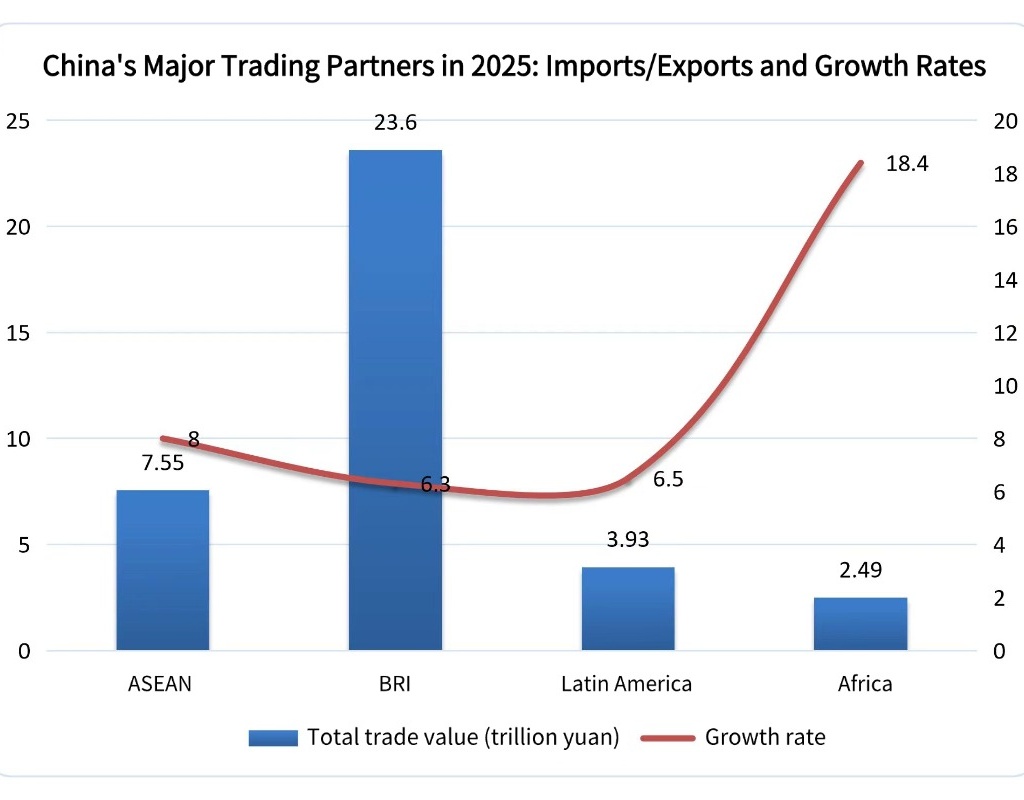
China’s Full-Year Import and Export Data 2025
Overview
China’s total annual import and export value reached 45.47 trillion yuan, marking an increase of 3.8%.
Within this figure, exports amounted to 26.99 trillion yuan, rising by 6.1%, while imports totalled 18.48 trillion yuan, growing by 0.5%.
Key Sectors
1,China’s exports of high-tech products totalled 5.25 trillion yuan, an increase of 13.2%.
2,Shipments of green products, such as the “New Three” (electric vehicles, lithium-ion batteries, and solar cells) and wind turbines, grew by 27.1% and 48.7%, respectively.
3,Exports of self-owned brand products rose by 12.9%, increasing their share in total export value by 1.4 percentage points.
4,Cross-border e-commerce import and export volume reached 2.75 trillion yuan, representing growth of 69.7% compared to 2020.
Market Highlights

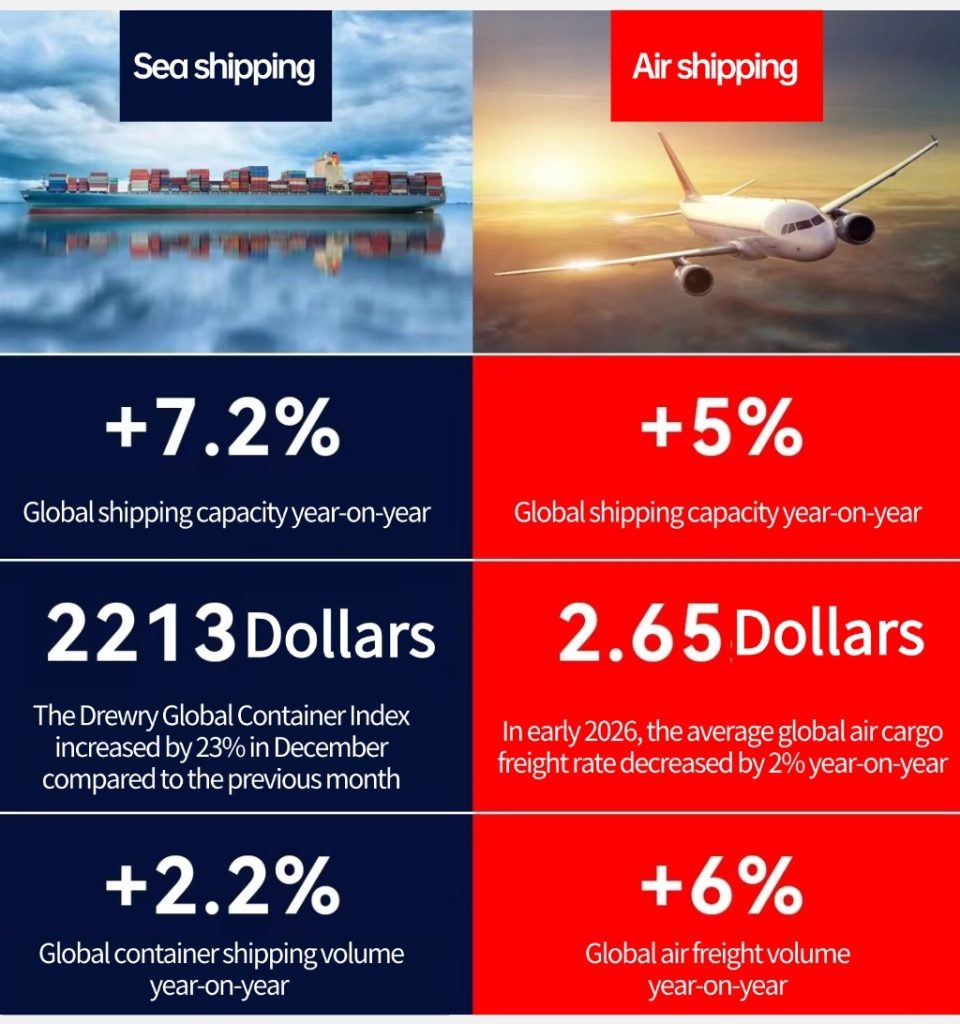
Red Sea Shipping: Recovery on the Horizon
Although the risk of conflict has decreased, it remains significantly higher than pre-crisis levels. It is anticipated that shipping companies will not resume the #Suez Canal route on a large scale before at least the latter half of 2026. Even if reopening occurs, the process will be gradual and subject to disruptions.
Impact on Shipping:
- Vessel congestion and scheduling disruptions are likely during the initial recovery phase.
- Insurance and security costs may offset the fuel/time savings offered by the Suez route.
- Freight rates are expected to face downward pressure in 2026 as congestion eases.
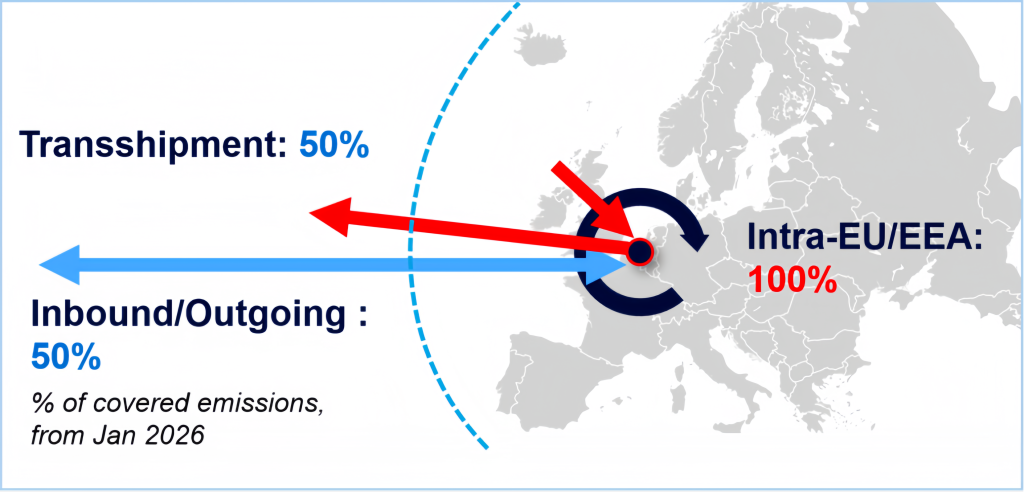
EU Emissions Trading System to Reach Full 100% Scope by End of 2026
Beginning in 2026, the #EU ETS will charge for 100% of emissions from all intra-EU voyages, with the associated carbon surcharge expected to increase by +43%–45%.
ETS Emission Coverage in 2026:
- Import/Export voyages: 50%
- Transshipment voyages: 50%
- Intra-EU/EEA voyages: 100%
Impact on Shipping:
- Carbon surcharges are projected to rise significantly as the scope of the ETS expands.
- Route optimization strategies, such as reducing intra-EU segments and utilizing transshipment to lower ETS exposure, will be increasingly adopted.
- More stringent carbon emission reporting requirements will lead to increased compliance costs.
Europe Sea Freight Route Updates
Asia-Europe (Freight Route)
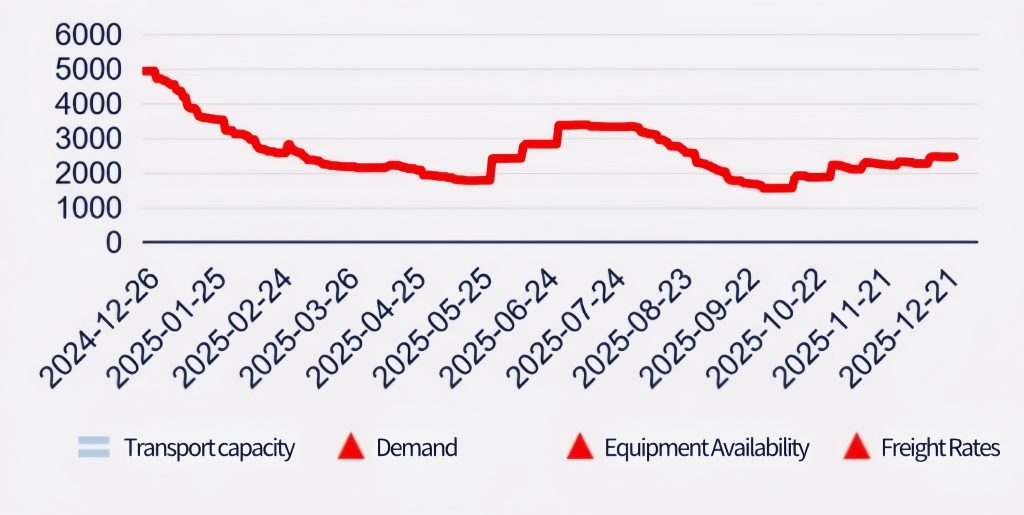
Asia → Northern Europe:
The SCFI (Shanghai Containerized Freight Index) continues to show a slight upward trend, with capacity utilisation rates steadily rising.
Average freight rates currently range approximately between USD 1,400 – 2,500.
Europe Air Freight Route Updates
Asia-Europe (Freight Route)
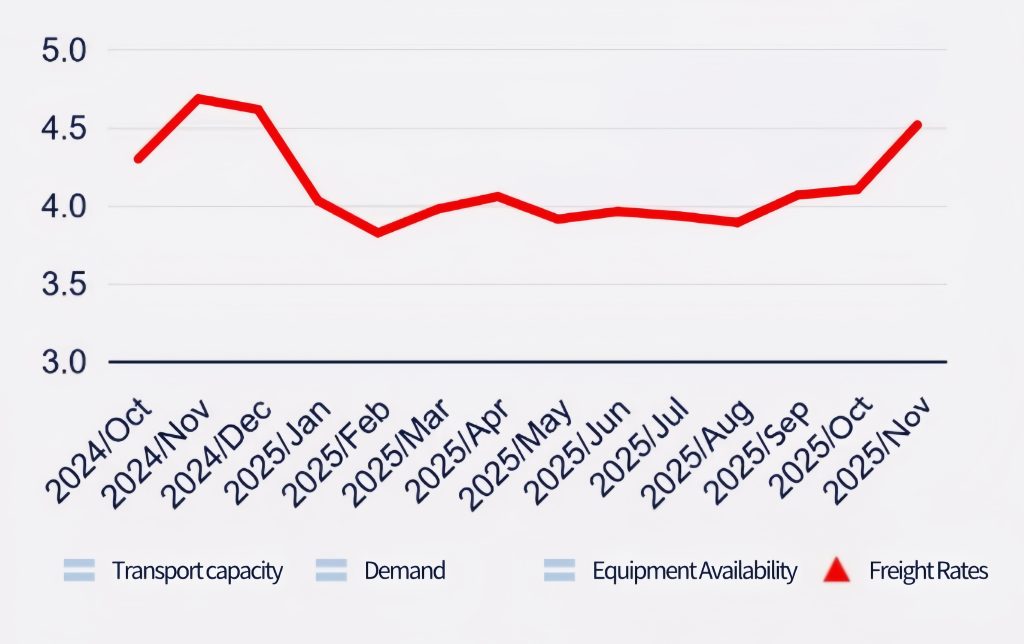
Increase in Demand:
As the Spring Festival and the end of the month approach, cargo volumes are steadily rising, and airlines’ published freight rates are also showing an upward trend.
Unit: per kilogram
*Trends and commentary are provided by CEVA’s operations team.
**Charts are based on WorldACD data.
Please note: Minor discrepancies may exist in the analysis due to variations in data sources.